
Executives should track business growth metrics across five areas: revenue quality, customers, profit and cash, operational capacity and people. The most useful dashboard combines leading indicators, such as qualified pipeline and capacity, with lagging results, such as revenue growth and gross margin. Together, they show whether growth is fast, profitable, repeatable and financially safe.
“Revenue can grow while the business becomes weaker. Executives need measures that reveal the quality, cost and operational strain behind every new dollar.”
What Are Business Growth Metrics?
Business growth metrics are quantified measures that show whether a company is expanding in line with its strategy and whether that expansion creates durable value. Strong metrics connect market demand, customer behaviour, profitability, cash, delivery capacity and organizational health. Each metric needs a definition, owner, target, data source and decision rule.
Do not confuse a metric with a KPI. A company may collect hundreds of metrics, but only the few tied directly to strategic outcomes are key performance indicators. BDC advises companies to link KPIs to strategic objectives, keep the set focused and report current data through a performance dashboard.
Which 12 Business Growth Metrics Should Executives Track?
The twelve essential business growth metrics are revenue growth, qualified pipeline coverage, customer acquisition cost, retention, gross margin, operating cash flow, cash conversion cycle, growth-investment payback, capacity utilization, delivery quality, revenue per employee and regrettable employee turnover. Their definitions should fit the company’s business model.
Demand and revenue quality
| Metric | Basic calculation | What it reveals |
|---|---|---|
| 1. Revenue growth rate | (Current revenue − prior revenue) ÷ prior revenue | The speed and direction of growth |
| 2. Qualified pipeline coverage | Qualified pipeline ÷ period sales target | Whether future demand can support the plan |
| 3. Customer acquisition cost | Sales and marketing cost ÷ new customers | The cost of winning each customer |
| 4. Customer retention | Customers retained ÷ customers at period start | Whether growth survives after acquisition |
Segment these business growth metrics by product, channel, region and customer type. A healthy company-wide average can hide a weak new market or an expensive sales channel. For subscription businesses, add recurring revenue retention or net revenue retention.

Profitability and cash
| Metric | Basic calculation | What it reveals |
|---|---|---|
| 5. Gross margin | (Revenue − direct cost) ÷ revenue | The value retained from each sale |
| 6. Operating cash flow | Cash generated by core operations | Whether growth funds or consumes cash |
| 7. Cash conversion cycle | Inventory days + receivable days − payable days | How long cash remains tied up |
| 8. Growth-investment payback | Initial growth investment ÷ monthly contribution | How quickly an initiative returns its cash |
Profit and cash answer different questions. Rapid sales can increase receivables and inventory before cash arrives. BDC recommends monitoring cash on hand, the cash conversion cycle and gross profit through a cash-flow dashboard. Praevion’s guide to growing without damaging profitability explains how to set financial guardrails.

Operations and people
| Metric | Example calculation | What it reveals |
|---|---|---|
| 9. Capacity utilization | Actual output ÷ practical capacity | Whether the operation can absorb more demand |
| 10. Delivery quality | Orders on time and correct ÷ total orders | Whether customer promises survive growth |
| 11. Revenue per employee | Revenue ÷ average employees | A broad signal of workforce productivity |
| 12. Regrettable turnover | Critical employees lost ÷ critical workforce | Whether growth is eroding essential capability |
Operational business growth metrics provide an early warning. Falling service quality, longer cycle times and persistent overtime often appear before customers leave or margins decline. Interpret productivity carefully. A better ratio may reflect stronger systems, but it can also reflect understaffing.

How Do You Build a Business Growth Metrics Dashboard?
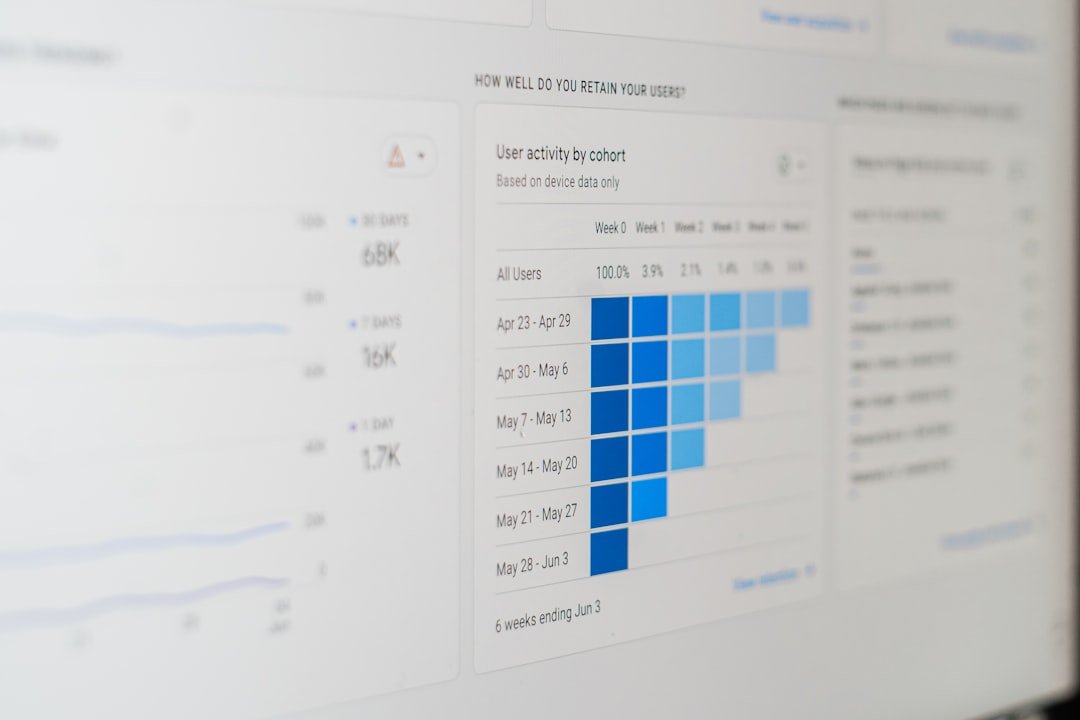
Build the dashboard by starting with strategic decisions, not available data. Select one to three business growth metrics for each material objective. For every KPI, document the formula, baseline, target, reporting frequency, source, owner, tolerance and action required when performance leaves the agreed range.
| Dashboard field | Executive purpose |
|---|---|
| Actual, target and trend | Shows direction and size of the gap |
| Segment view | Reveals where performance differs |
| Forecast | Provides a forward-looking estimate |
| Owner and next action | Turns reporting into accountability |
| Decision threshold | Defines when leaders intervene |
Benchmark financial ratios by industry and company size where useful. Statistics Canada publishes current financial ratios by enterprise size, including profitability, liquidity, solvency and efficiency measures. Benchmarks provide context, not automatic targets.
How Often Should Executives Review Business Growth Metrics?
Review cash, pipeline and serious service risks weekly; the full executive dashboard monthly; and strategic targets quarterly. The meeting should explain material movement, test the forecast and make decisions. A dashboard that produces no action becomes reporting theatre.
Remove a metric when it no longer supports a decision. Add one only when a new strategic risk or growth priority requires it. Stable definitions matter, but the dashboard should evolve with the business.
What Should Executives Do Next?
Choose six to twelve business growth metrics that reflect the company’s current growth model and risks. Agree on definitions before setting targets. Then run the dashboard for two review cycles and remove any measure that does not improve a real decision. Before making a major commitment, use the measures to test whether the business is ready to scale.
For help designing an executive dashboard and growth-management cadence, contact Praevion Consulting Inc.
Frequently Asked Questions About Business Growth Metrics
What is the most important business growth metric?
There is no universal single metric. Revenue growth matters, but executives should read it beside gross margin, operating cash flow, retention and capacity. The most important KPI is the one tied to the company’s current strategic decision and material risk.
What is the difference between leading and lagging growth indicators?
Leading indicators signal what may happen, such as pipeline, conversion and capacity. Lagging indicators confirm results that already occurred, such as revenue, margin and cash flow. A useful dashboard contains both.
How many KPIs should an executive dashboard contain?
There is no fixed number, but focus matters. Six to twelve enterprise-level KPIs are often manageable for a growing SME. Departments may use supporting measures, provided definitions and ownership remain clear.